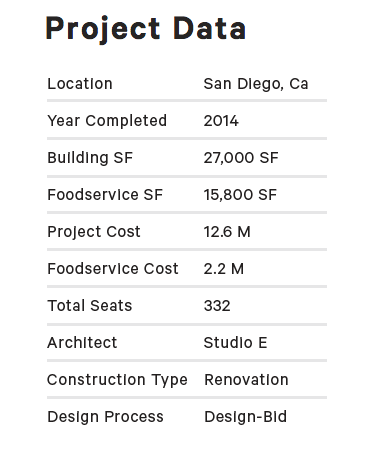
From the to-do list: CSS Production ✔ project data chart: graphic to text update (Completed by Taylor Bernard on March 23, 2015) Screen Shot 2015-03-23 at 1.13.58 PM.png Comments Justin Bernard on March 23, 2015: need to update that from graphic to txt, itll be used again and again on diff site sectionseasiest way would be to have each hor line be a div. make two kinds, one that has a outline at bottom, so something like .row and .row_nolinethat way you can use data on all the rows, but use data_noline on the very bottom since they don't put a underline on the bottom onethen once you have those in place, you can just put col_left and col right in each row, and position accordinglyso like <div class="data_grid"> <div class="row"> <div class="col_left">Year Completed</div> <div class="col_right">2014</div> </div></div>so .row would have the bottom border linecol_left would be top:0 left:0col_right could use abs pos to of top: 0 and right however much it needs to get the spacing correct on that right column
Comments
Justin Bernard on March 23, 2015:
easiest way would be to have each hor line be a div. make two kinds, one that has a outline at bottom, so something like .row and .row_noline
that way you can use data on all the rows, but use data_noline on the very bottom since they don't put a underline on the bottom one
then once you have those in place, you can just put col_left and col right in each row, and position accordingly
so like
<div class="data_grid">
<div class="row">
<div class="col_left">Year Completed</div>
<div class="col_right">2014</div>
</div>
</div>
so .row would have the bottom border line
col_left would be top:0 left:0
col_right could use abs pos to of top: 0 and right however much it needs to get the spacing correct on that right column